0
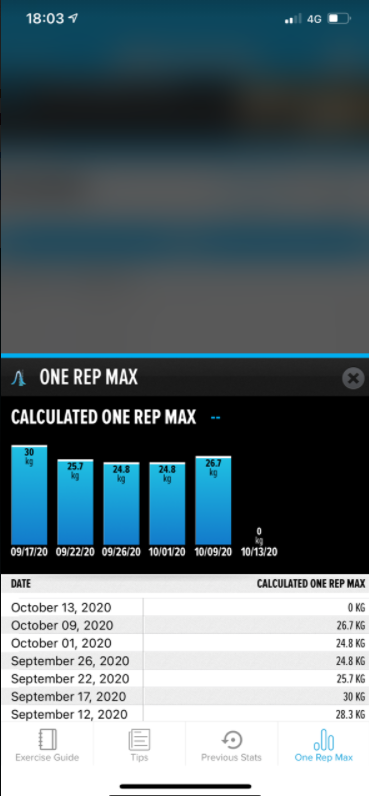
Change charts to add decimals and all logs for this exercise
Here is a graph from another app that I have used. I can see this graph when I’m executing the exercises or when I finish them.It has decimals, more readings, and on the bottom I can scroll all the logs of this exercise that I’ve done.Just a suggestion.

Customer support service by UserEcho
